
Every system needs control, and AMPS is no exception. We already have a pretty powerful and flexible Admin module that provides various information about the AMPS instance and the host system, in several formats such as XML, JSON, CSV, and plain text. It is very convenient for applications, scripts, services… but what about humans? We, the people, prefer information processed and visualized. Among many other cool features that AMPS 5.2 introduced, this one is literally very easy to notice. Ladies and gentlemen, allow me to introduce the new admin interface: Galvanometer!
What is Galvanometer?
Galvanometer is the new graphical AMPS admin interface. It is included and enabled by default in all AMPS instances starting from 5.2. It doesn’t require any additional installation steps, simply go to the admin address and it’s already there! Don’t worry, the classic admin module is there as well, and will always be.
Some of the features of Galvanometer:
- Live Instance stats, such as Messaging, Clients, Lifetime, and so forth;
- Live Host stats, such as Memory, CPU utilization, Networking, Storage;
- Time Machine;
- Built-in SOW/Subscribe functionality (special thanks to our new JavaScript client);
- Details about Views, Topics, SOW;
- Replication monitoring;
- Transaction Log monitoring;
- Graph Builder.
Are you excited to take a look? Let’s do it right now!
Know your Instance
Instance is the main page of Galvanometer. It visualizes and updates in real time the most important information about a running AMPS instance:
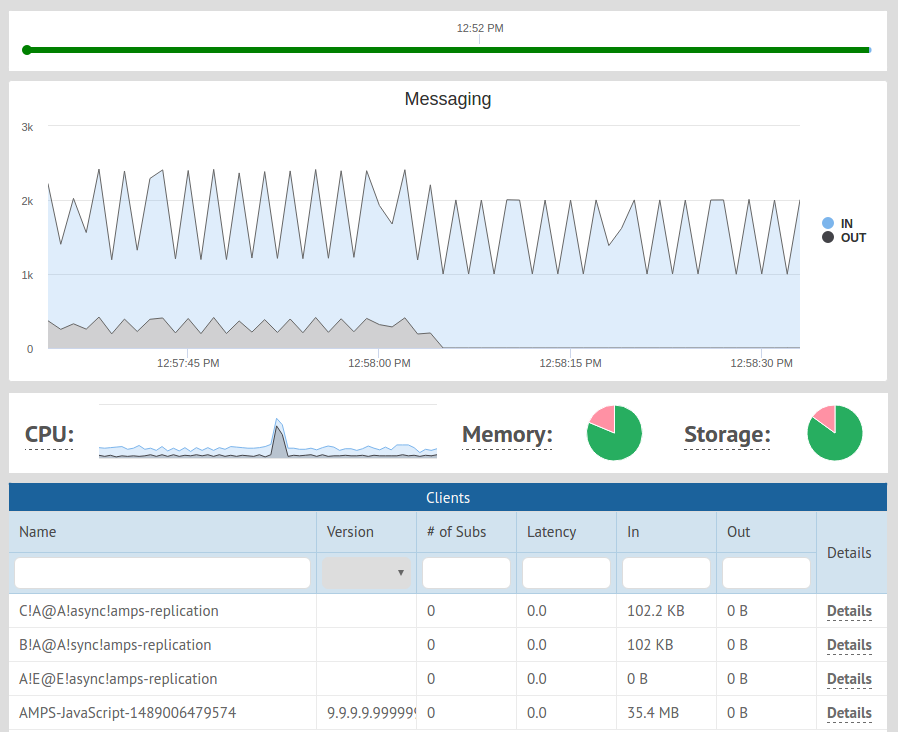
On this page you can find:
- The Lifetime widget, a bar that represents the life span of the instance, including shutdown periods, occured minidumps, etc;
- The Messaging widget that visualizes the messaging stream of the instance. In real time you can see how many messages are being processed by AMPS;
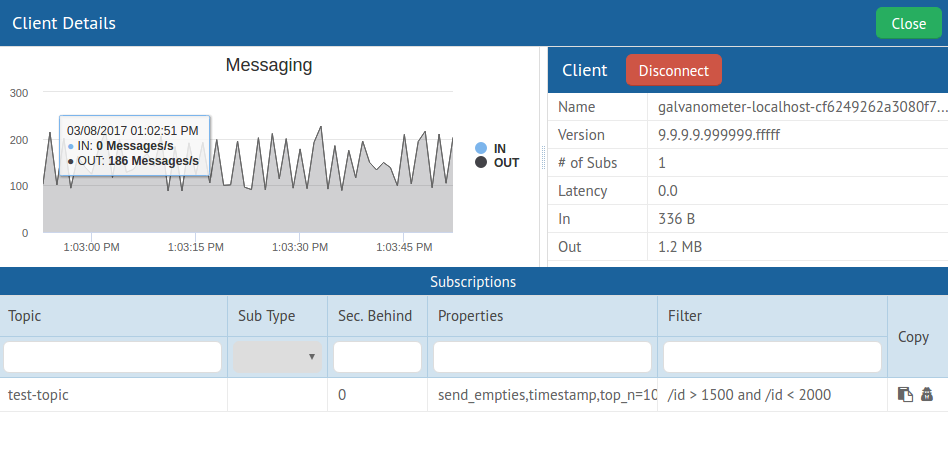
- The Clients table with the list of connected clients and their status and activity. If you click on a listed client
you will be able to see its contribution to the total messaging stream on the Messaging widget. Double click or
a click on the
Detailslink will provide full information about the client, including its subscriptions, messaging, etc:
Host: Hardware Monitoring
It is important to know not only how and what the AMPS instance is doing, but its Host as well. Galvanometer has a dedicated page to monitor the host, including it’s CPU cores utilization, memory, storage and networking:
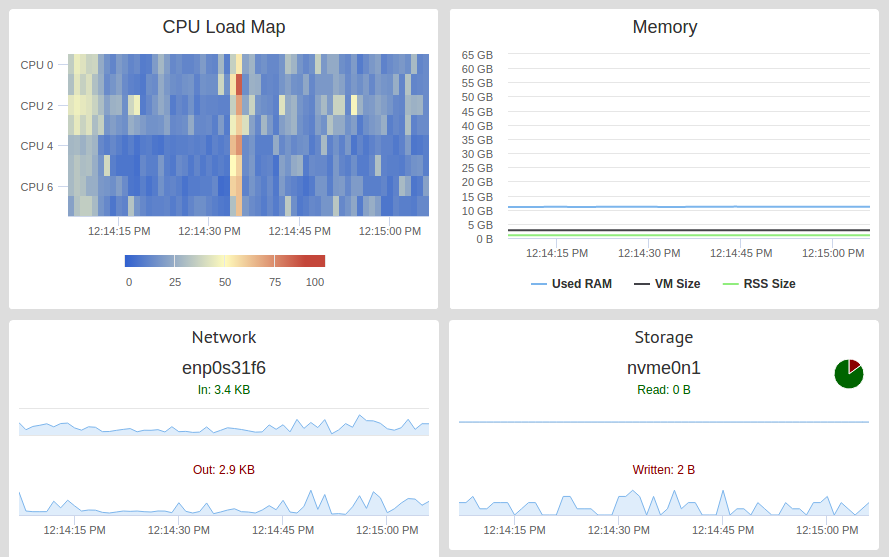
All these widgets refresh automatically in real time.
Great Scott! Time Machine!
Ever wonder how many messages AMPS was processing 30 minutes ago? Do you want to see how the CPU was utilized during the holiday season? All it takes is to travel back in time and see with your own eyes… But it is impossible without a time machine, you might say. Not for us! Our engineers hacked time itself and now we proudly present a working Time Machine that is shipped with every Galvanometer:
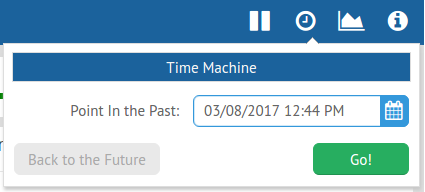
Select the date and time you want to travel to and hit Go!. Time travel won’t take long and soon you’ll see this the same
page, but in the past. It’s even paused so you can take your time and look around. Once you’re adjusted to the past,
hit the Play button again to resume the time flow. Be careful: you’re still in past!
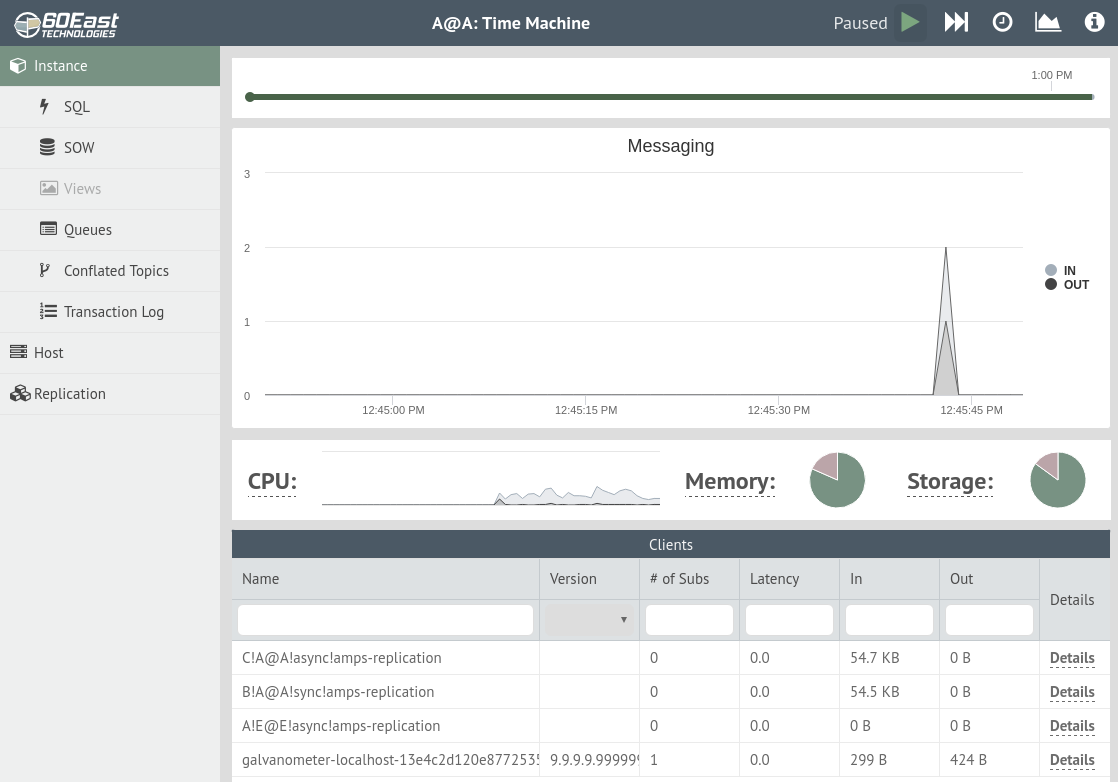
Currently, our time machine only works with AMPS and Galvanometer, stay tuned for updates!
SQL: SOW and Subscribe without leaving Galvanometer
Wouldn’t it be nice to be able to subscribe to regular topics and query SOW topics and see the the results right away without leaving Galvanometer? We thought so too, and that’s why every Galvanometer contains a built-in AMPS client, allowing users to get real time information about the data flow:
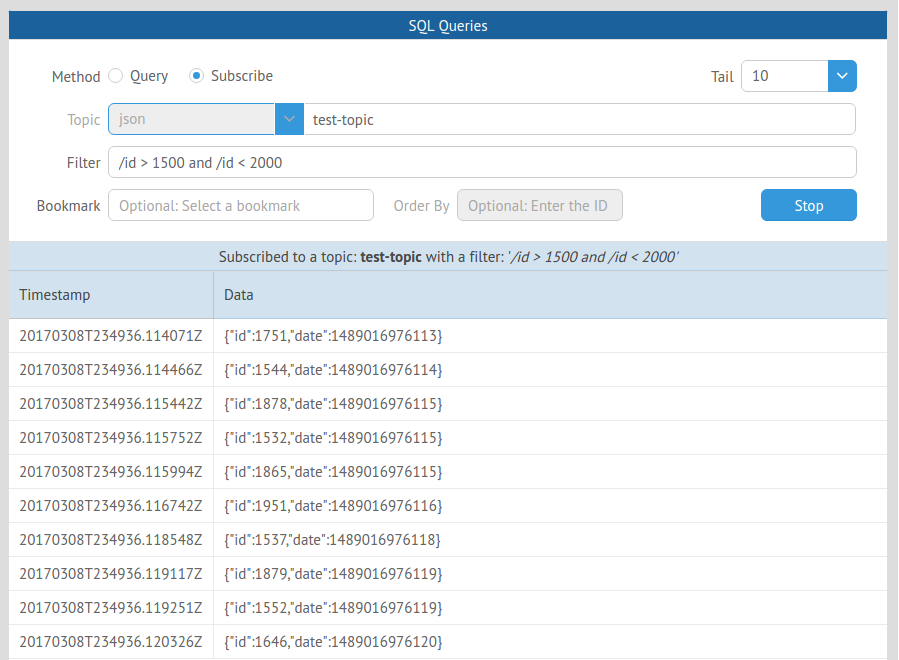
This uses our new JavaScript Client: stay tuned for more details in a future blog post!
Replication: See the Big Picture
Replication allows to build a distributed yet synchronized system of AMPS instances. Now it is very easy to visualize your replication fabric and get information about data flow between replicated instances!
Galvanometer provides three ways of representing replication:
- Chorded replication Graph;
- Replication Matrix Table;
- Force-directed replication Graph.
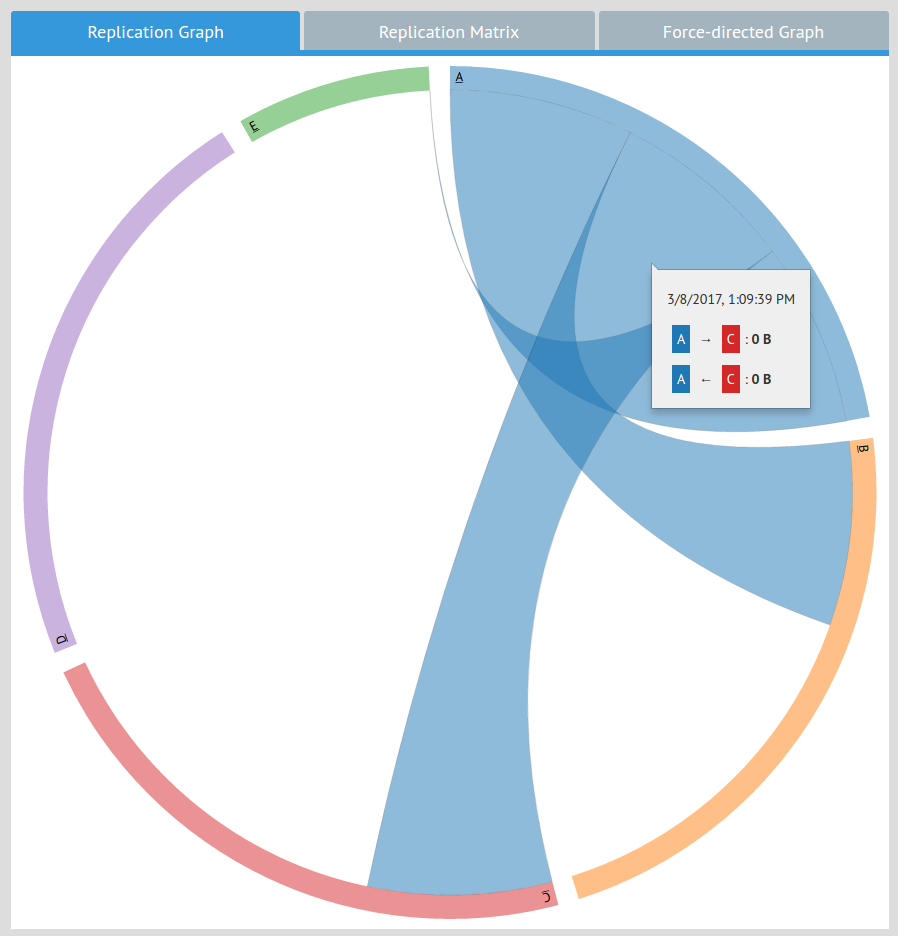 Chorded Graph
 Replication Matrix
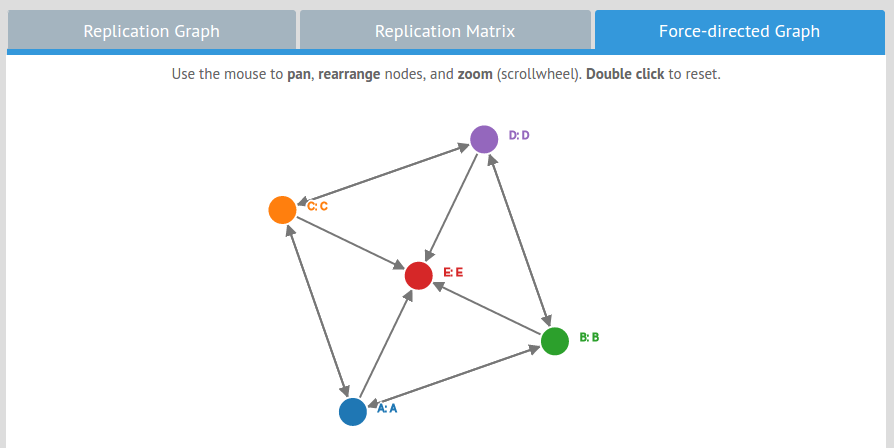 Force-directed Graph
Fine-grained Stats with the Graph Builder
Graph Builder is a nice tool that allows you to watch and monitor a particular metric through time. Let’s say you want to see how AMPS was consuming memory for last twenty minutes, or during peak hours last Thurdsay.
It’s never been easier - just search for a metric, pick one from the dropdown menu, select a time range, and voilà:
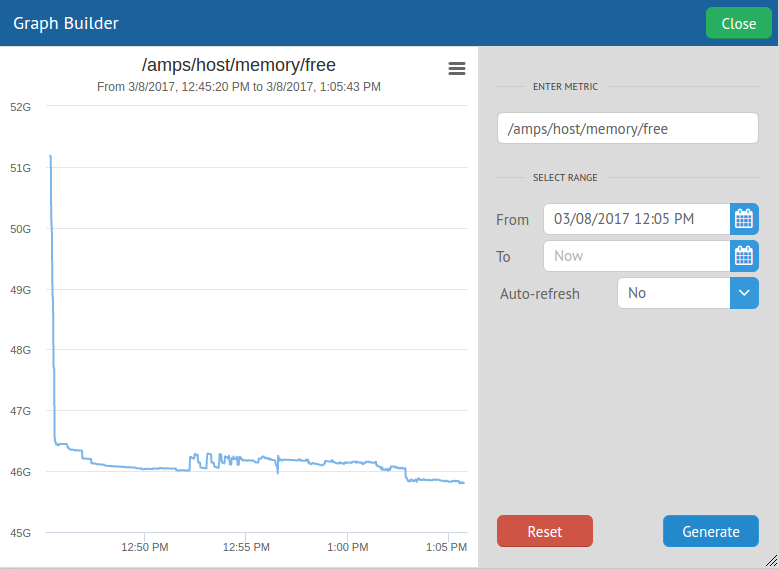
The generated graph can be saved as an image or a PDF file.
Try it today!
Galvanometer is available and enabled by default in the newly released AMPS 5.2. It has a metric ton of cool features — give it a try! Please share your feedback and comments with us. Let us know how the Galvanometer is making your life easier :)
